Preserving Immune Diversity for Healthy Aging
Adaptive immune diversity falls from early adulthood while age-related disease risk rises in mirror image. MyImmune is building the evidence and the infrastructure to flatten that curve.

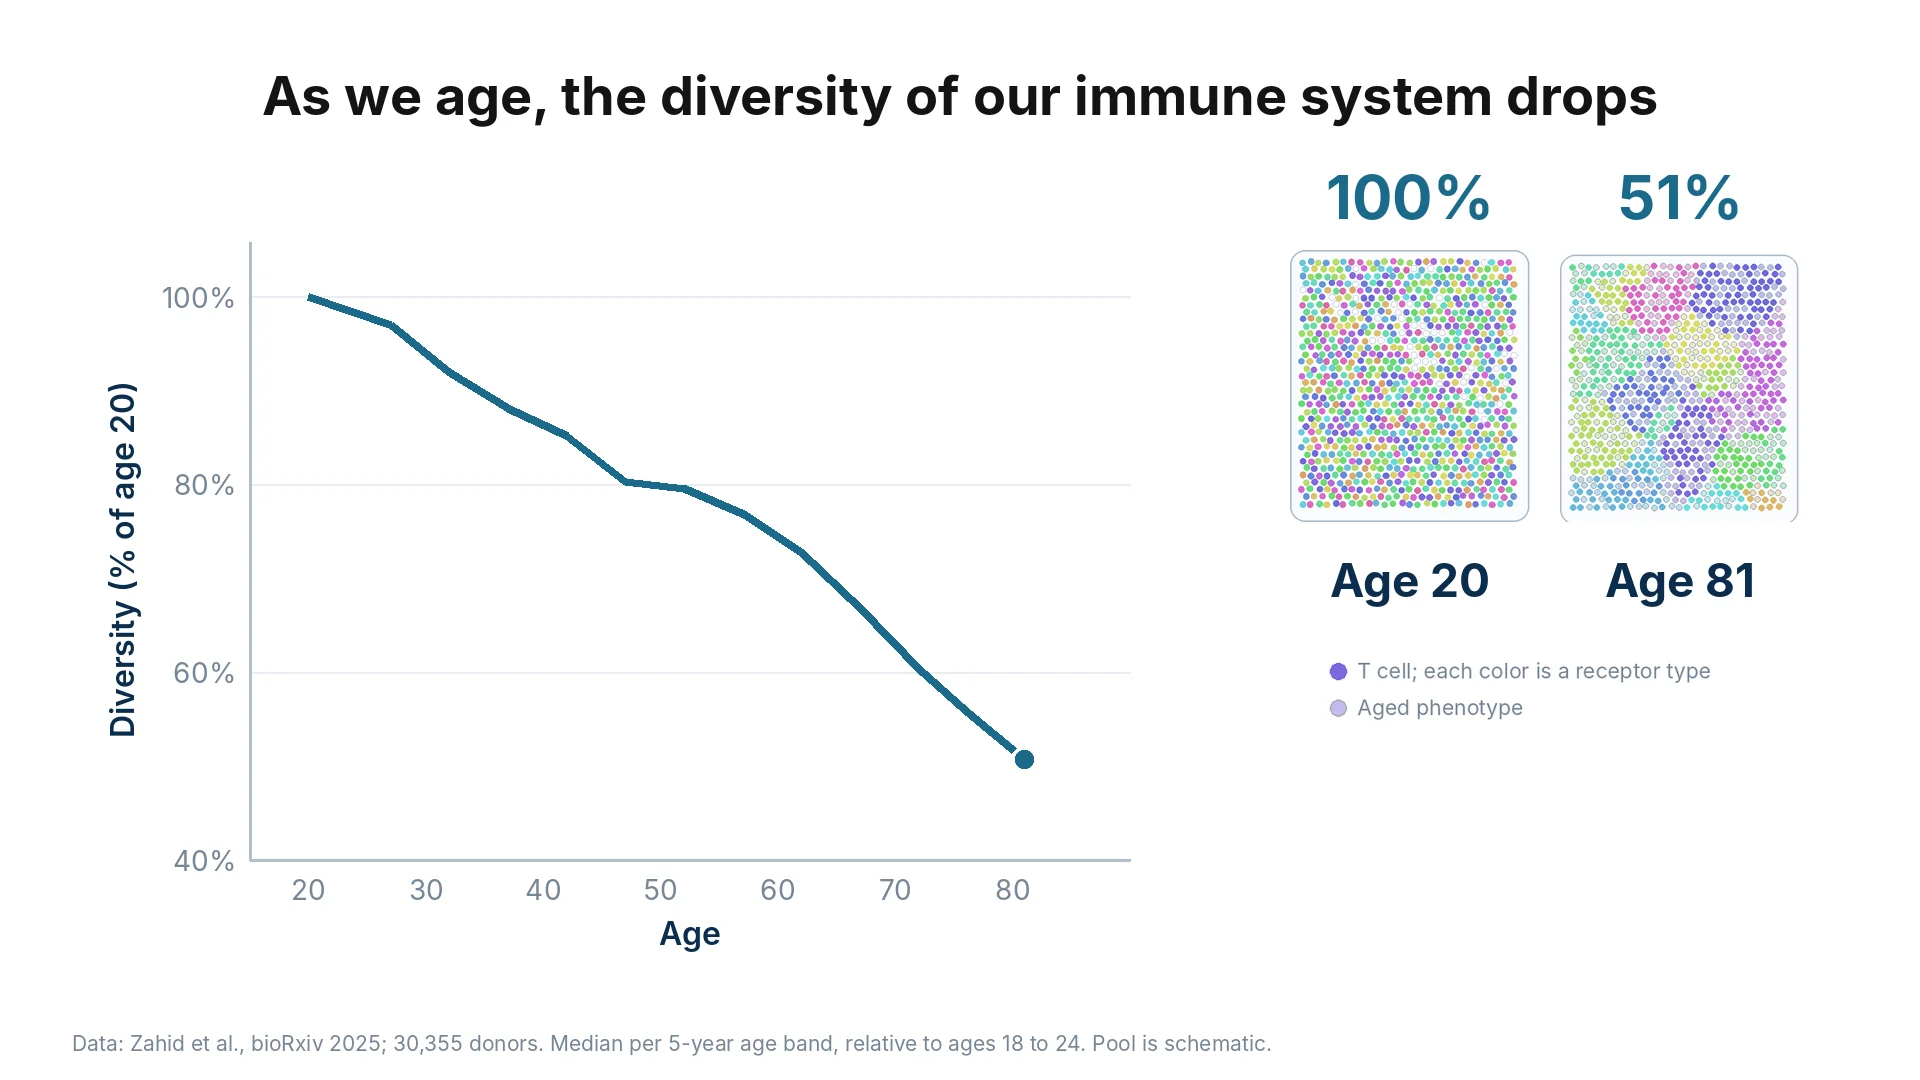
As We Age, the Diversity of Our Immune System Drops
Across 30,355 donors, the number of unique T cell receptors a person carries falls from 100% at age 20 to 51% by age 81 (Figure 1). The decline is gradual and continuous, so by the time it becomes clinically visible, the repertoire that would have been worth preserving is already gone.
Figure 1. Adaptive immune diversity by age, relative to age 20. Median per 5-year age band. Data: Zahid et al., bioRxiv 2025, 30,355 donors.
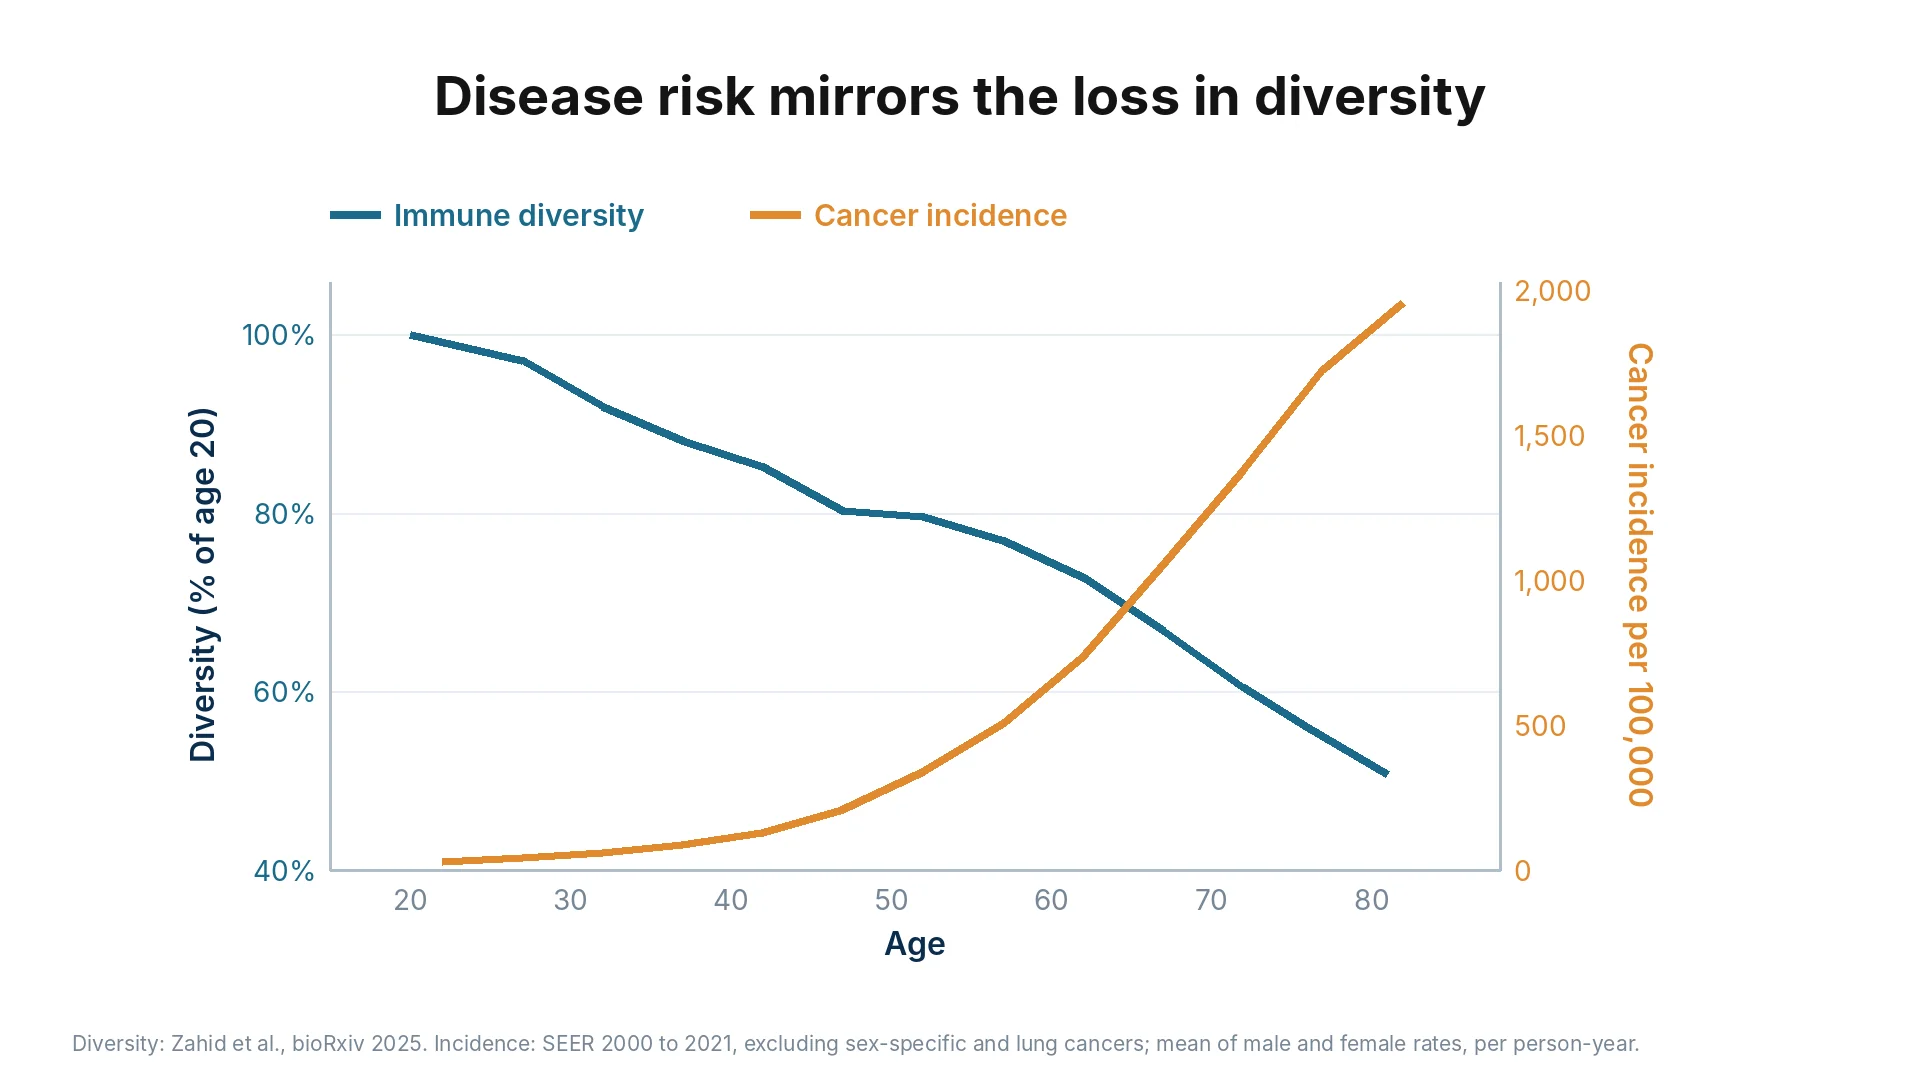
Disease Risk Mirrors the Loss in Diversity
Plotted on a shared age axis, cancer incidence rises as immune diversity falls, and the two curves cross in the seventh decade (Figure 2). The mirror image is striking, but on its own it is only a correlation.
Figure 2. Immune diversity and cancer incidence by age. Diversity: Zahid et al., bioRxiv 2025. Incidence: SEER 2000 to 2021, excluding sex-specific and lung cancers.
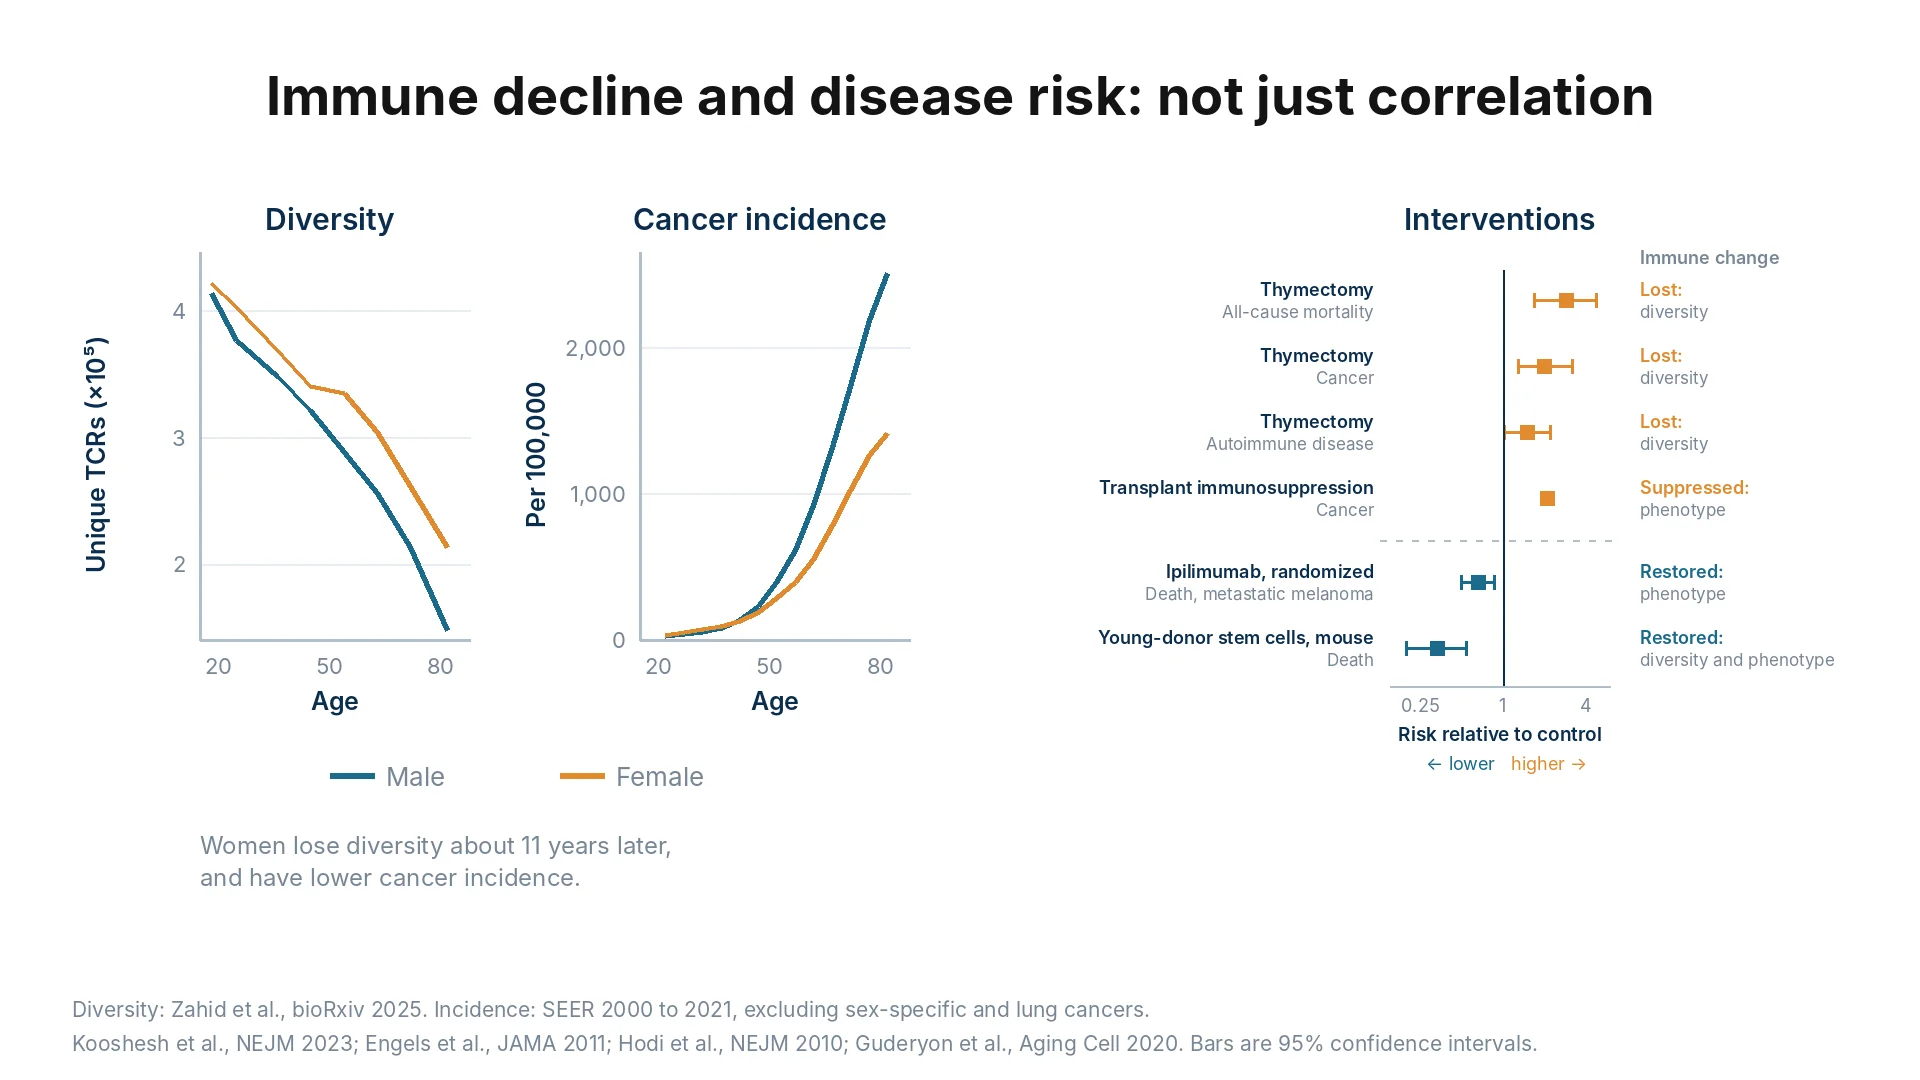
Immune Decline and Disease Risk: Not Just Correlation
Before acting on that correlation, it has to be worth acting on. Several independent lines of evidence indicate that the loss of diversity contributes to the rise in risk rather than merely accompanying it (Figure 3). Women lose T cell receptor diversity about 11 years later than men and have lower cancer incidence across age bands. Adults who undergo thymectomy lose diversity and face roughly twice the risk of cancer, alongside elevated all-cause mortality and autoimmune disease (Kooshesh et al., NEJM 2023), and transplant immunosuppression similarly elevates cancer risk. In the other direction, restoring T cell phenotype with checkpoint blockade in metastatic melanoma, or restoring both diversity and phenotype with young-donor stem cells in mice, lowers mortality relative to controls.
Figure 3. Diversity and cancer incidence by sex, and risk relative to control for interventions that lose or restore immune diversity or phenotype. Bars are 95% confidence intervals. Kooshesh et al., NEJM 2023; Engels et al., JAMA 2011; Hodi et al., NEJM 2010; Guderyon et al., Aging Cell 2020.
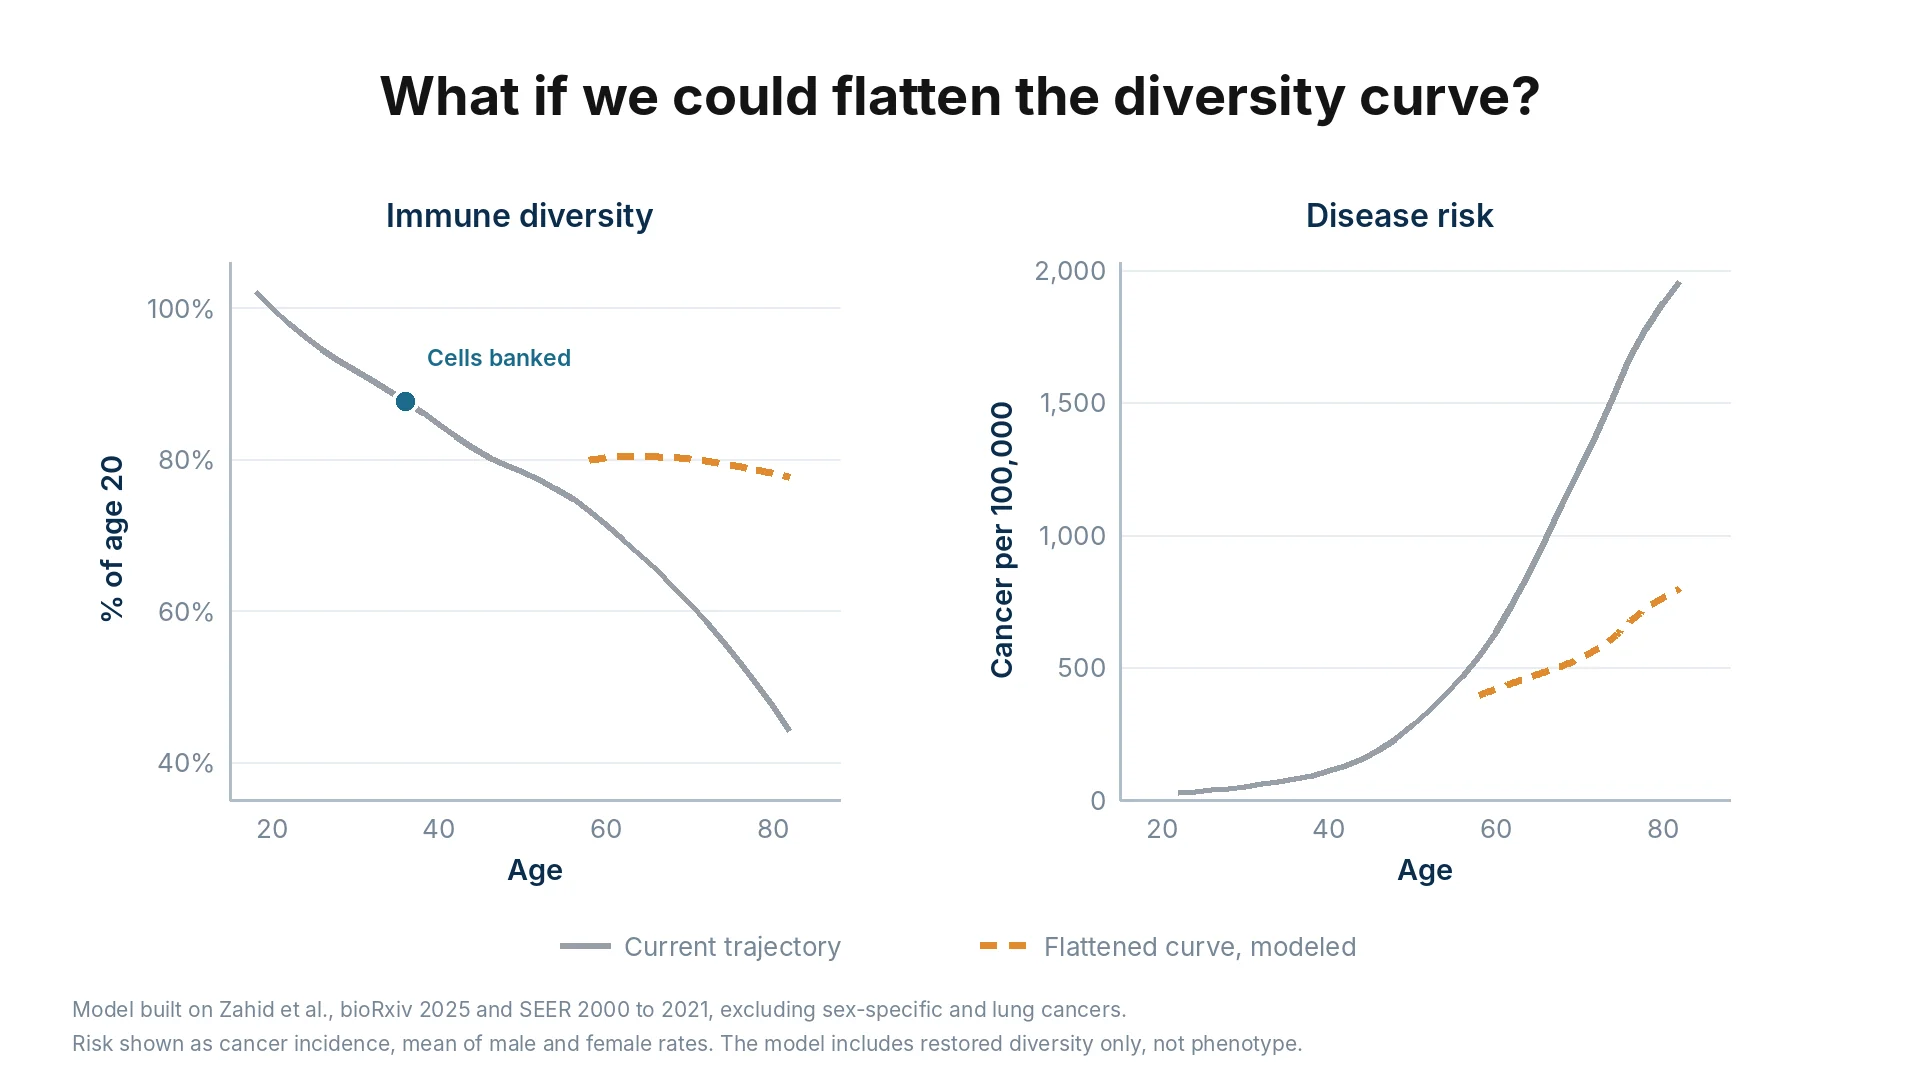
What If We Could Flatten the Diversity Curve?
If the causal link holds, the question becomes what a flattened curve would be worth. Modeling built on human T cell receptor diversity across 30,355 donors and on SEER cancer incidence from 2000 to 2021 indicates that banking immune cells while diversity is high, then restoring diversity later in life, could flatten the age-related decline and substantially lower cancer incidence after age 60 (Figure 4).
Figure 4. Modeled immune diversity and cancer incidence with and without restored cells. Risk shown as cancer incidence, mean of male and female rates. The model includes restored diversity only, not phenotype.
Biobank, Monitor, Reinfuse
Collect cells while diversity is high, track the repertoire, and return them later in life.
Biobank
Collect and store immune cells while diversity is still high. A young immune system replaces what is taken.
Monitor
Sequence the repertoire at intervals under one standardized protocol, so samples taken years apart stay comparable.
Reinfuse
Return the person's own banked cells later in life, and measure whether diversity is restored.
Young Immune Cells Replenish Themselves
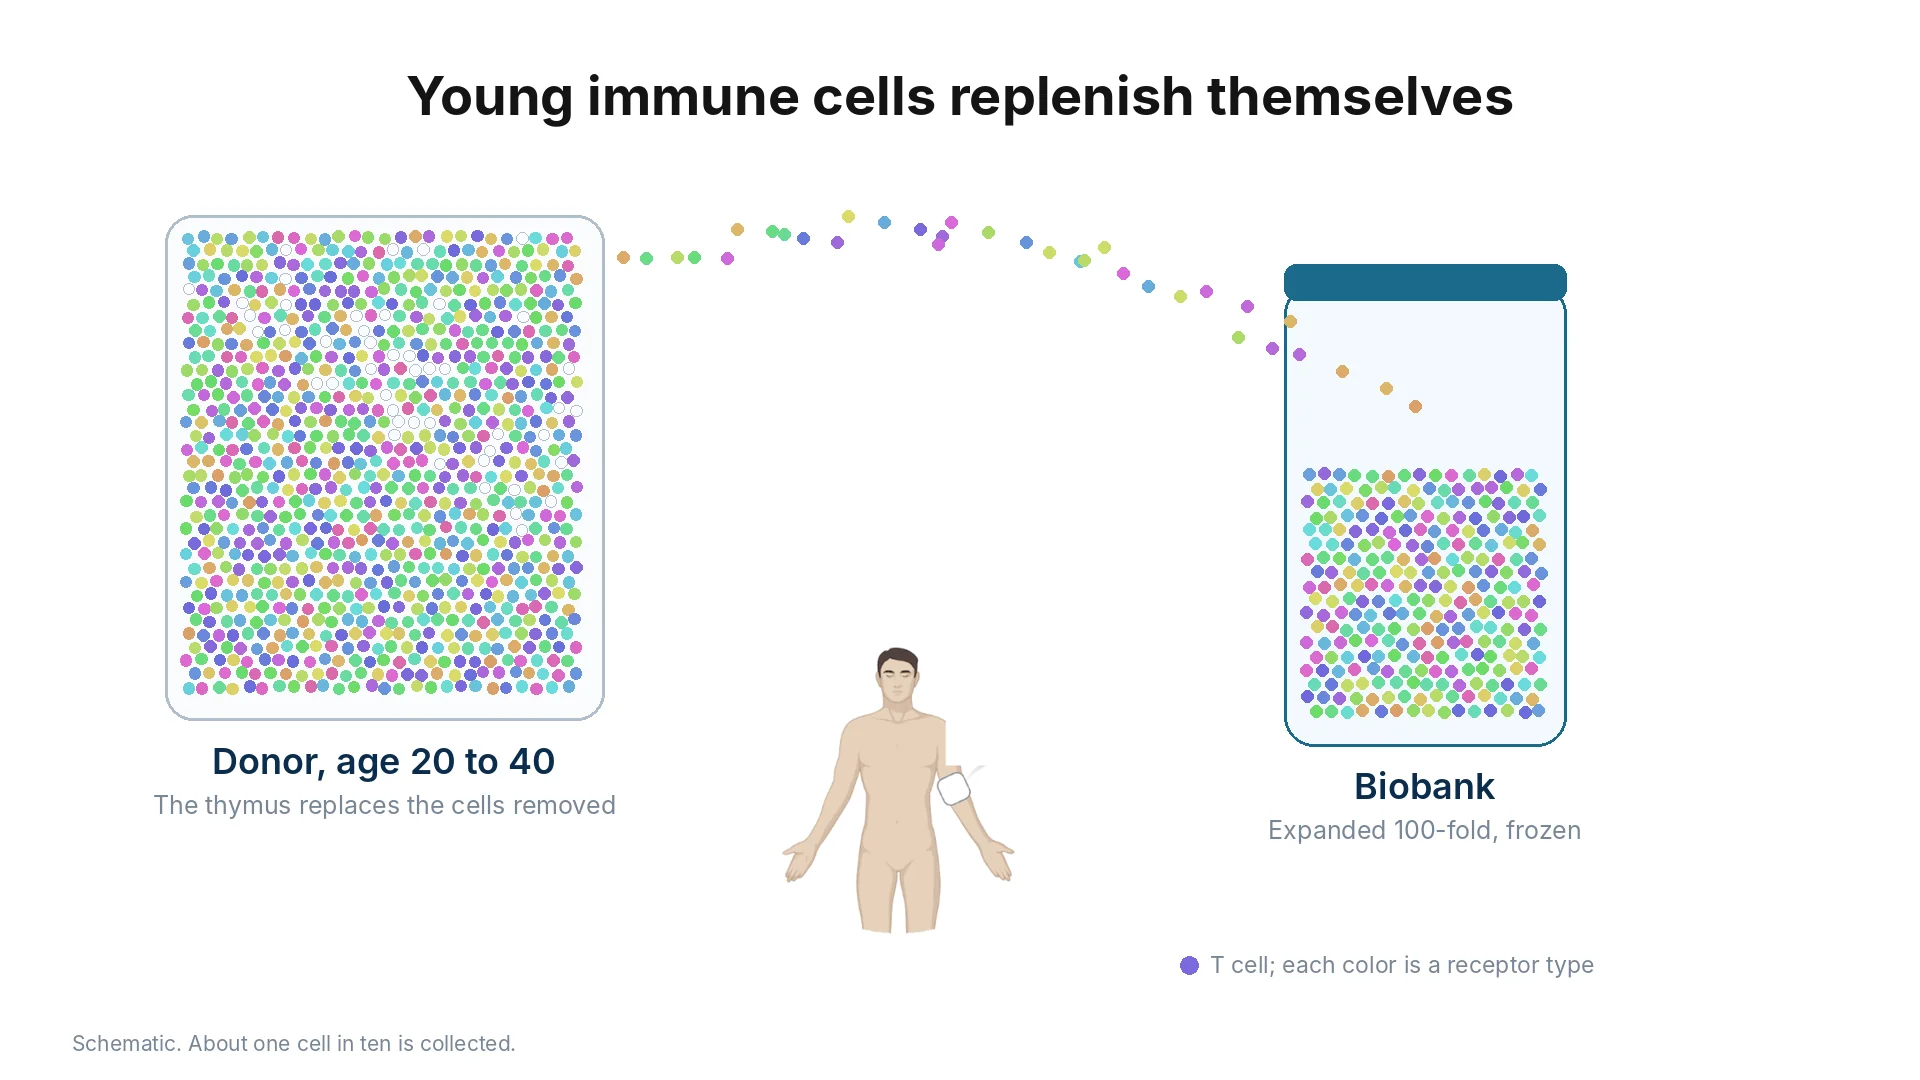
Peripheral blood mononuclear cells are collected from a donor between the ages of 20 and 40, taking roughly one cell in ten. The thymus replaces what is removed, while the collected cells are expanded 100-fold and cryopreserved (Figure 5).
Figure 5. Collection and biobanking of young immune cells. Schematic; about one cell in ten is collected.
Reinfuse Your Own Biobanked Cells to Restore Diversity
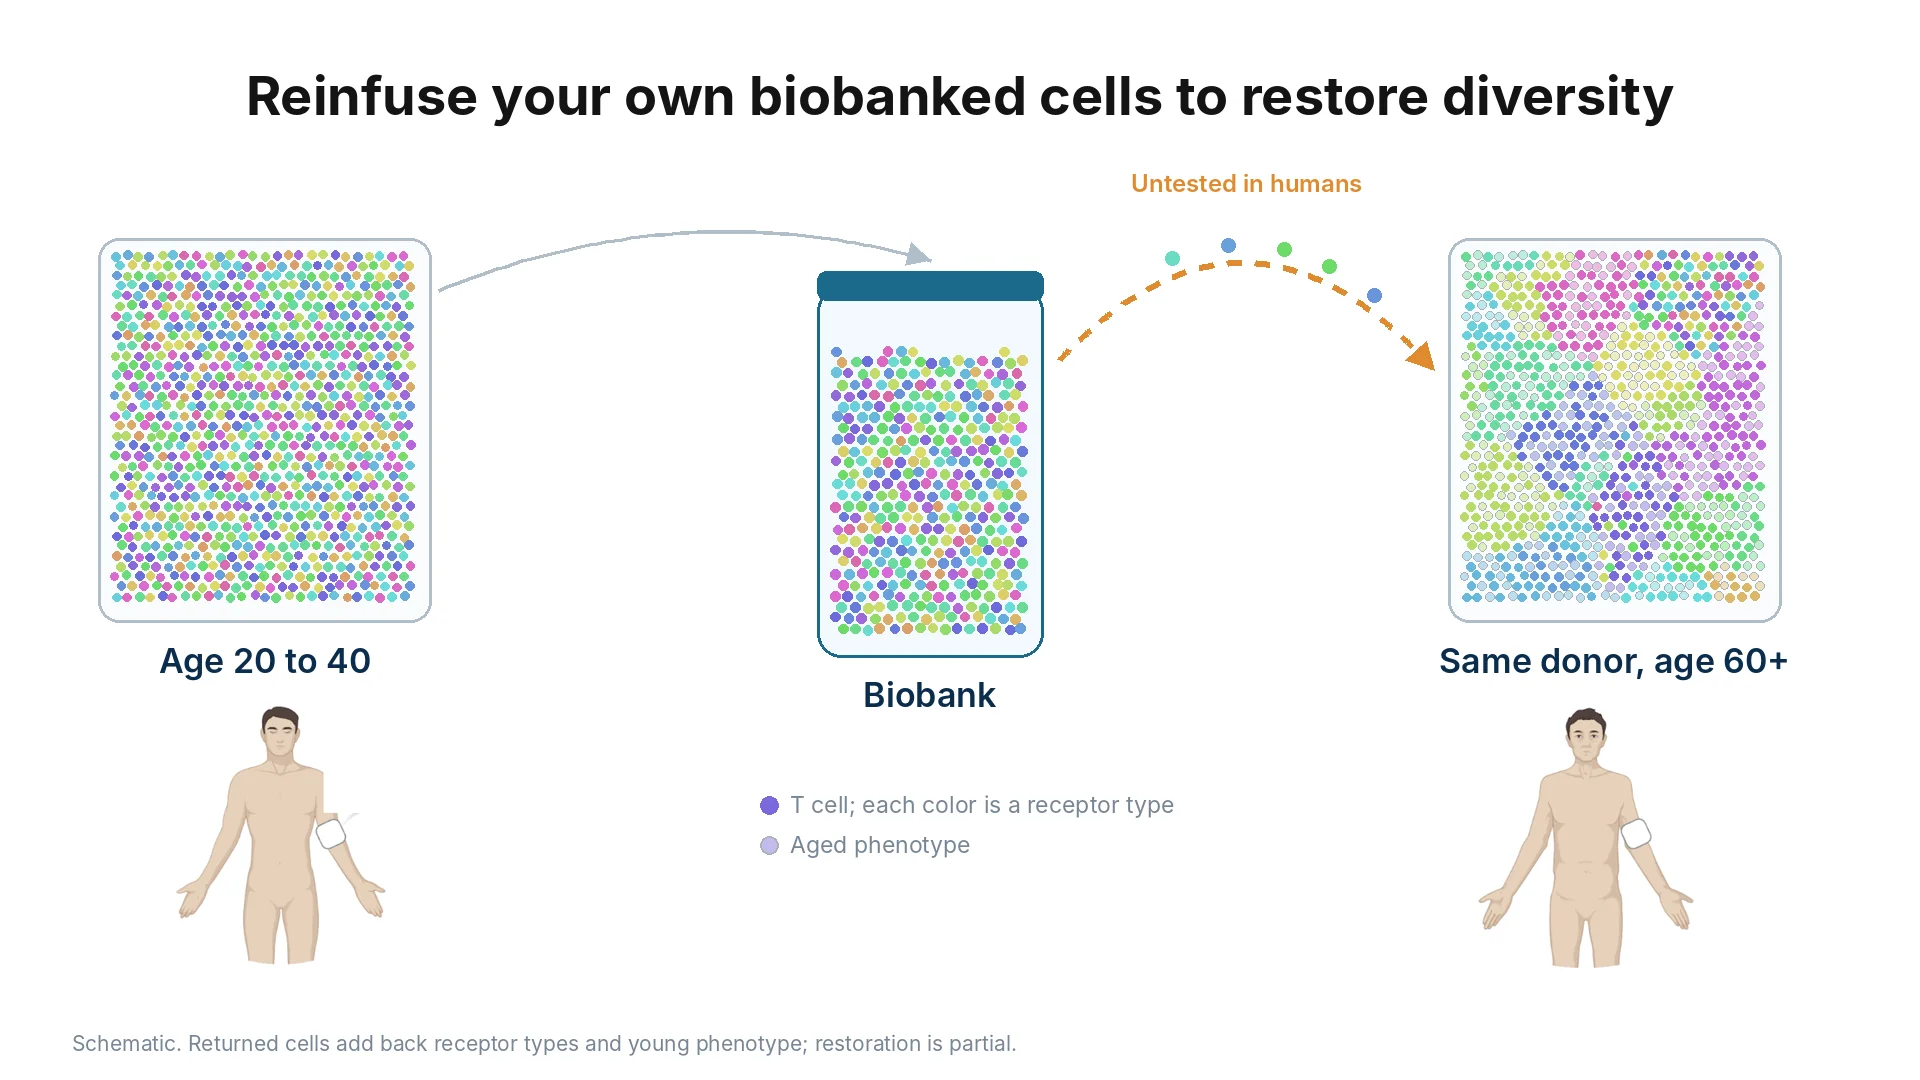
Later in life, returning the same donor's cryopreserved cells adds back receptor types and youthful cellular phenotypes that have since been lost, partially restoring repertoire diversity (Figure 6). This step is untested in humans, and it is the part of the thesis our animal work is designed to test.
Figure 6. Autologous reinfusion at age 60 and over. Schematic; returned cells add back receptor types and young phenotype, and restoration is partial.
Data from the Biobank Will Provide the Next Generation of Cures
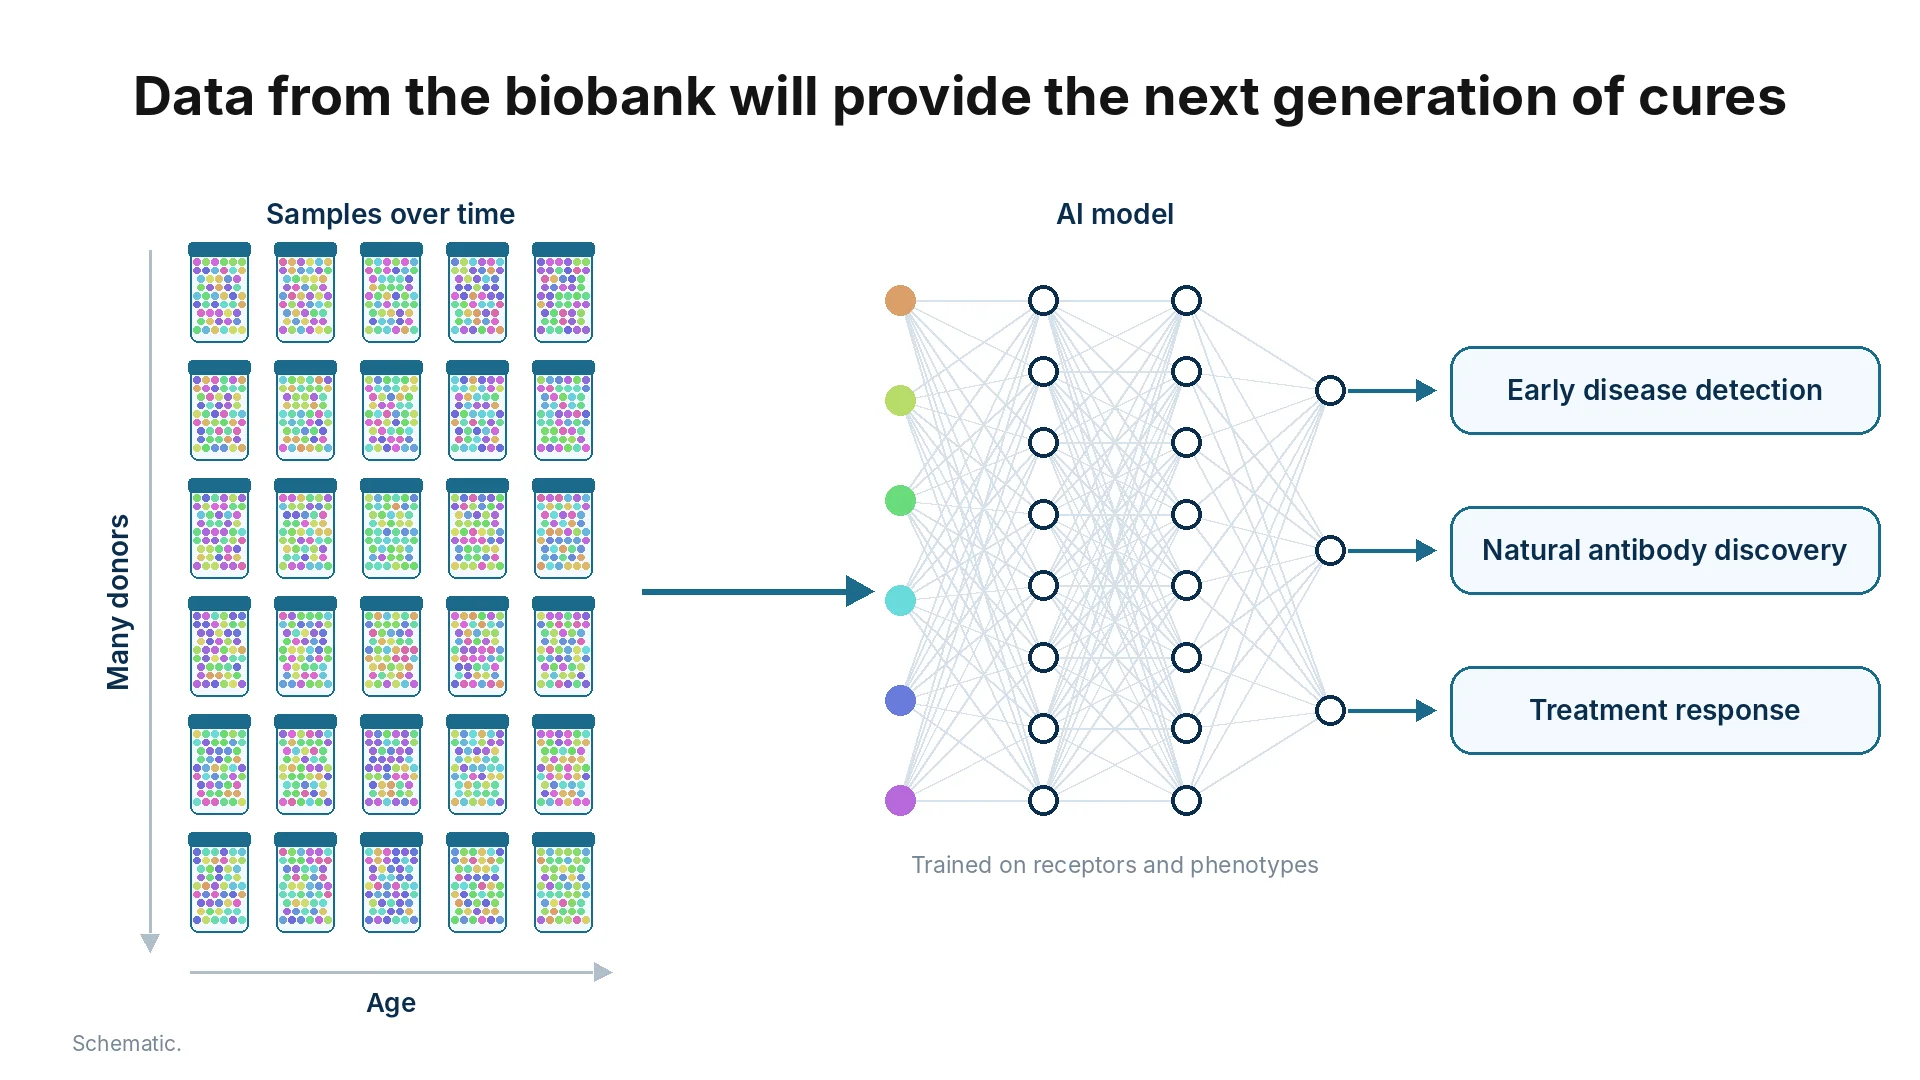
Longitudinal samples collected across many donors and ages under a single standardized sequencing protocol create an unprecedented dataset linking T cell and B cell receptor sequences to clinical phenotypes. Training MyImmune's deep learning models on these receptors and phenotypes, including our FACTS framework, which reached a mean AUROC of 0.95 across five diseases and healthy controls, supports three clinical applications: early disease detection from pre-symptomatic repertoire shifts, natural antibody discovery by mining B cell receptor repertoires from healthy-aging donors, and prediction of treatment response (Figure 7).
Figure 7. Longitudinal biobank data as training data for repertoire models. Schematic. FACTS: Jiravejchakul et al., bioRxiv 2025.
Kyoto University Clinical Bioresource Center
MyImmune has an agreement with the Kyoto University Clinical Bioresource Center covering standardized B cell receptor sequencing for natural human antibody discovery. Discussions are active to extend that collaboration to longitudinal cancer and longevity research, pairing MyImmune's repertoire models with clinical phenotyping.
References
Zahid et al., bioRxiv 2025 (30,355 donors). SEER cancer incidence 2000 to 2021. Kooshesh et al., NEJM 2023. Engels et al., JAMA 2011. Hodi et al., NEJM 2010. Guderyon et al., Aging Cell 2020. Jiravejchakul et al., bioRxiv 2025 (FACTS).
Partner With Us
We are looking for clinical, biobanking and investment partners to test whether immune diversity can be preserved and restored.